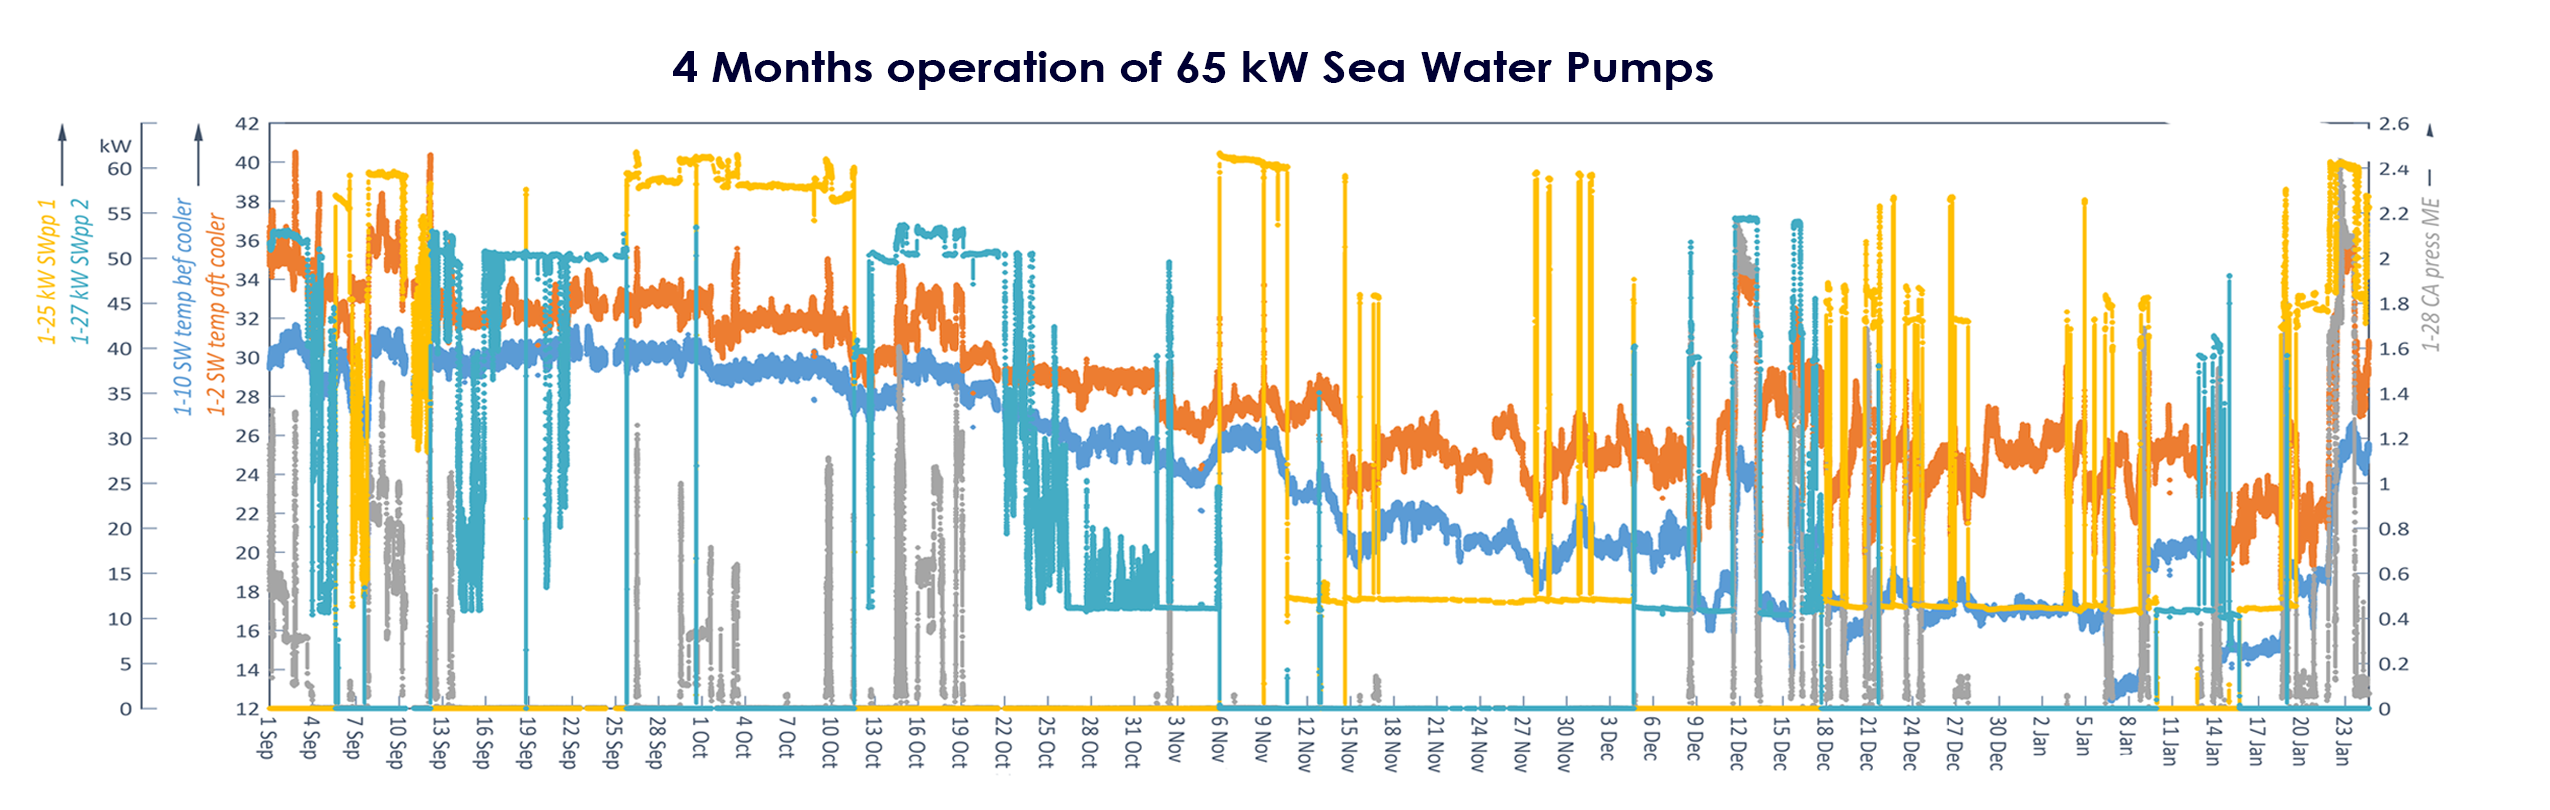
The graph demonstrates the change of average Sea Water Cooling pump load due to Sea Water Temperature and the huge saving potential; the vessel been employed on
"round the world voyages" over the 10 months period it is seen that the high electric load is requested only when Sea Water temperature reaching 30-32°C.
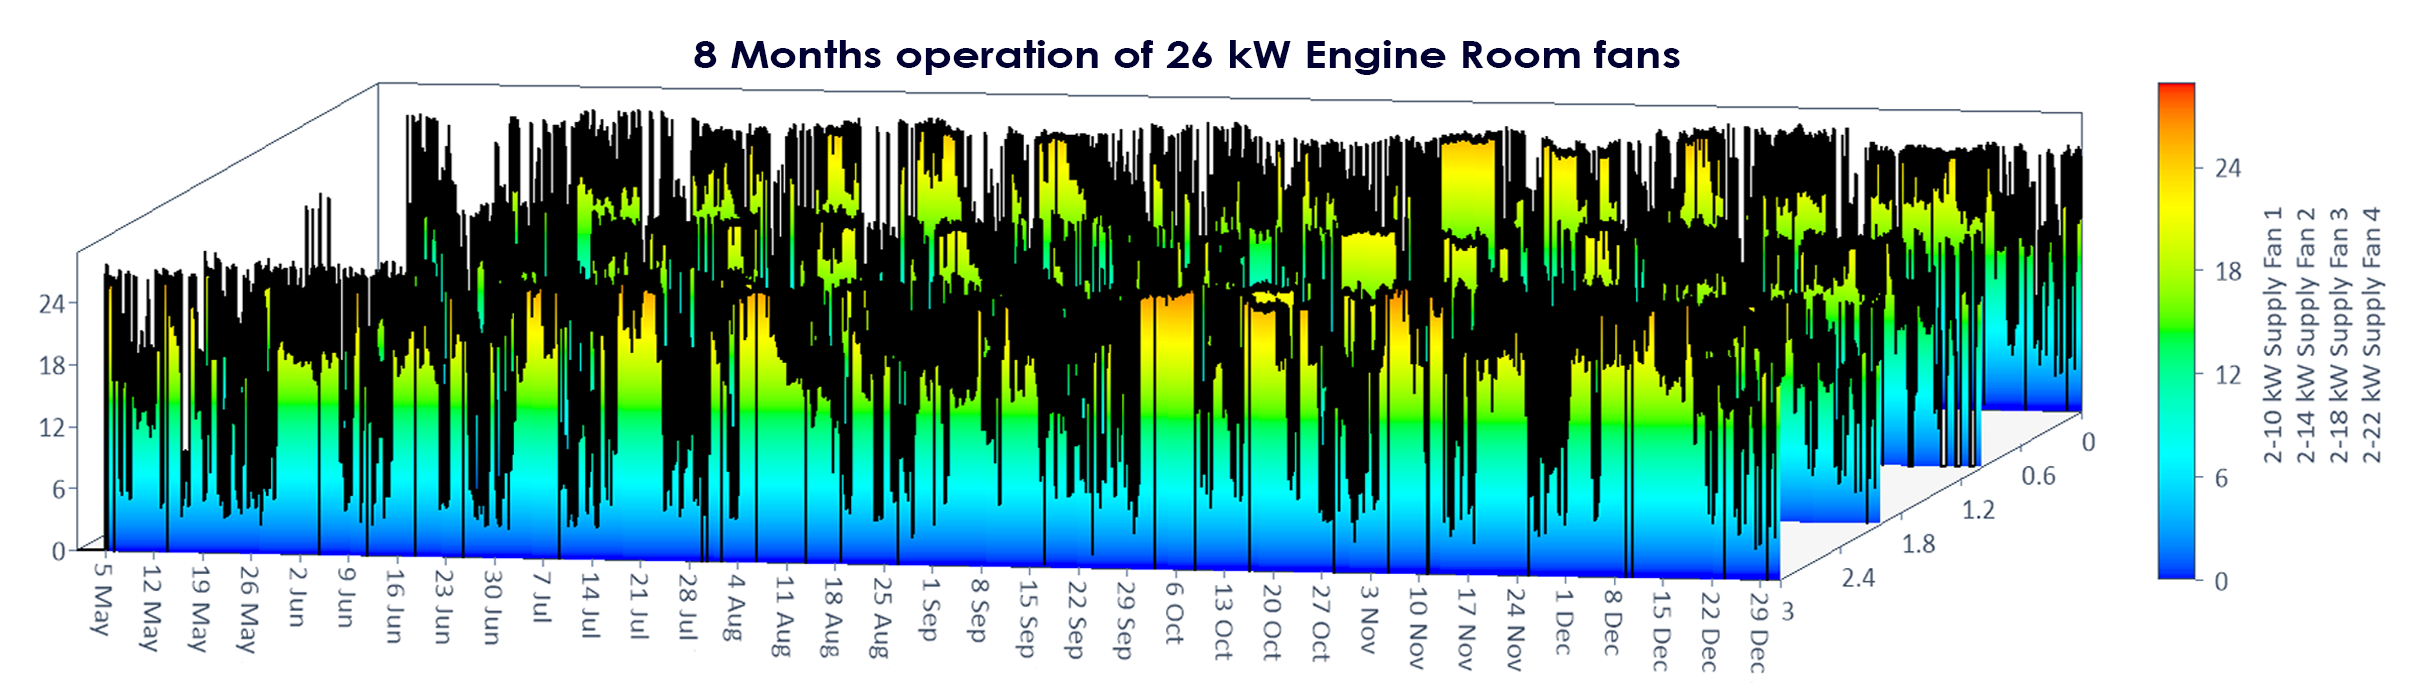
The graph shows the variation in speed depending on air demand by the main engine.
The data sample demonstrate how savings increase with decreasing Sea Water Temperature.
The blue curve "1-10 SW temp bef cooler" shows in early Seoptember up to 32°C, falling to 12-20°C in January.
The load level of the Sea Water pump in operation falls accordingly.
The grey curve "1-28 CA Press ME" shows the main engine operation based on charge air pressure and the interaction of the cooling system.

 Energy Efficiency Controller Executive Summary